- 10-month low in crude oil helps drives oil stocks and U.S. inflation expectations lower
- Unemployment claims remain near decade-plus lows
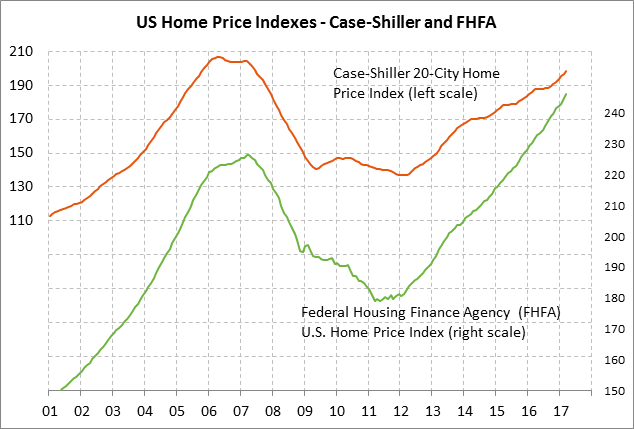
- FHFA U.S. home prices expected to show continued strength
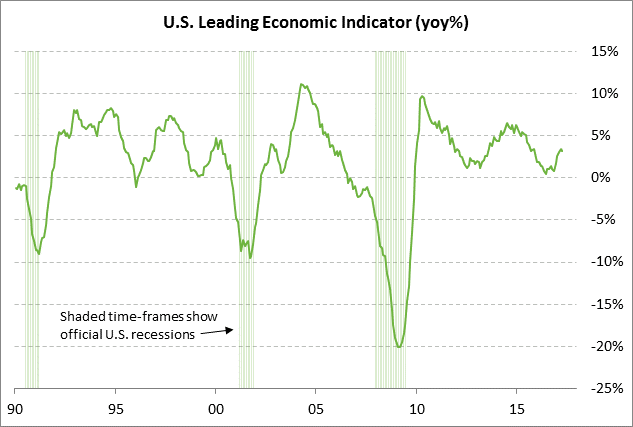
- LEI expected to show continued strength
- 30-year TIPS auction
10-month low in crude oil helps drives oil stocks and U.S. inflation expectations lower — Aug WTI crude oil futures prices on Wednesday extended the month-long plunge to post a new 10-month low on the nearest-futures chart and close the day down -$0.98 (-2.25%) at $42.53.
Aug crude oil has now plunged by -19% in the past month because (1) the 9-month extension of the OPEC/non-OPEC production agreement to Q1-2018 is viewed as insufficient to meet OPEC’s goal of bringing global oil inventories down to the 5-year average, (2) U.S. oil production continues to rise despite sub-$50 oil prices, and (3) Libya and Nigeria have both been ramping up production since they are exempt from the production agreement. Libya’s oil output has now risen to a 4-year high of 902,000 bpd and Nigeria’s May oil production rose by +6% to a 14-month high of 1.7 million bpd.
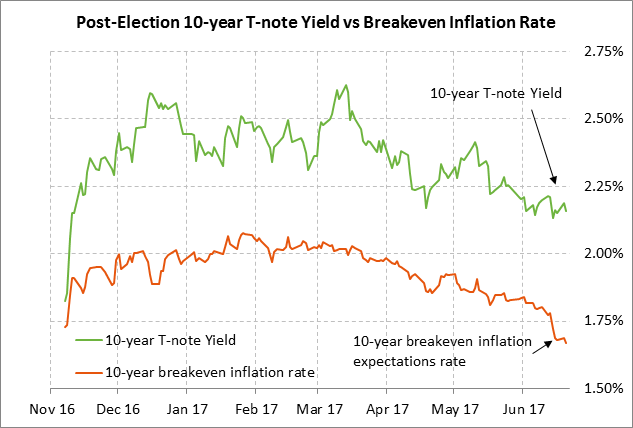
Wednesday’s continued plunge in oil prices helped push the 10-year breakeven inflation expectations rate to a new 8-month low of 1.66%. Since the current down-leg in crude oil prices began on May 25, the 10-year breakeven rate has fallen by -17 bp, which in turn has helped T-note yields to fall by -9 bp.
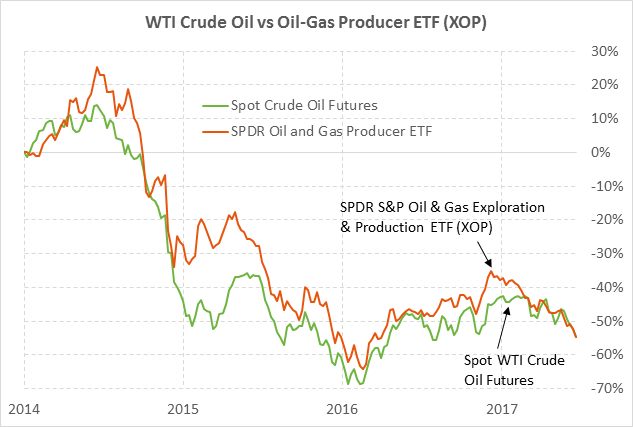
Meanwhile, Wednesday’s continued sell-off in crude oil prices caused the SPDR S&P Oil and Gas Exploration and Production ETF (XOP) to fall to a new 1-1/4 year low. XOP has now plunged by -33% from the peak seen in December when optimism was at its highest about the Nov 30 OPEC production cut agreement.
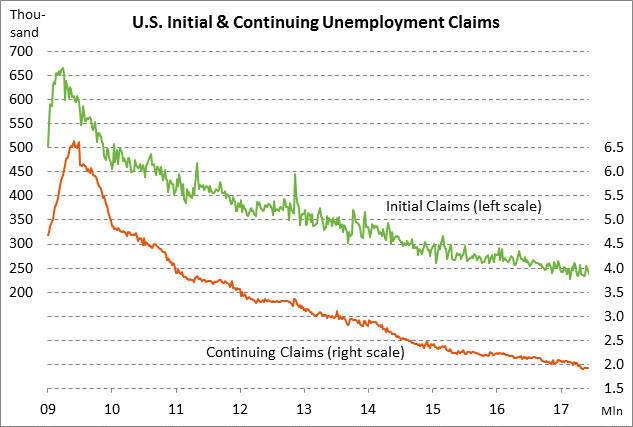
Unemployment claims remain near decade-plus lows — The initial and continuing unemployment claims series both remain near decade-plus lows, illustrating that businesses are holding on tightly to their employees. The initial claims series is only +10,000 above the 44-year low of 227,000 posted in February and continuing claims are just +36,000 above the 29-year low of 1.899 million posted in May. The market consensus is for today’s report to show a small +3,000 increase in initial claims to 240,000 and a -7,000 decline in continuing claims to 1.928 million.
On the labor front, the U.S. unemployment rate in May fell to a 16-year low of 4.3%, thus matching the Fed’s forecast for late this year and falling to just 0.1 point above the forecast for next year of 4.2%. The low unemployment rate illustrates that the Fed has already met its policy goal of full employment. However, payroll job growth has decelerated in the past three months to an average of only +121,000. The markets are waiting to see whether that slower hiring is a function of weaker U.S. economic growth, or whether businesses are simply reducing new hiring because they have already hired 16.4 million new employees since the Great Recession ended.
FHFA U.S. home prices expected to show continued strength — The consensus is for today’s FHFA Apr house price index to show another strong increase of +0.5% m/m, adding to the strong increases of +0.8% in February and +0.6% in March. The FHFA index in March was up sharply by +6.2% y/y and was up by a total of +37% from the housing-bust low seen in March 2011.
U.S. home prices continue to rise due to strong home demand combined with tight supplies. U.S. existing home sales are near a 10-year high. Meanwhile, the 4.2 month supply of homes on the market is well below the 7-8 month level that the National Association of Realtors says is consistent with steady home prices. The continued rise in home prices is very positive for consumer wealth and confidence.
LEI expected to show continued strength — The consensus is for today’s May leading indicators report to show an increase of +0.3%, matching April’s +0.3% increase. The LEI has been relatively strong since December, which bodes well for the U.S. economic outlook. The LEI showed increases of +0.6% in Dec-Jan, +0.5% in Feb, and +0.3% in March-April. On a year-on-year basis, the LEI in April was up +3.2% y/y, which was just -0.1 point below March’s 1-1/2 year high of +3.3%.
The market consensus is that U.S. Q2 GDP will rebound to +3.0% after showing weak growth in Q1 of +1.2%. The market is then expecting GDP growth to settle in around +2.4% in the second half of 2017. The recent U.S. economic data has been disappointing as seen by the fact that the Bloomberg U.S. Economic Surprise index has plunged in the past 2-1/2 months to a 9-month low. However, the Fed remains confident that the U.S. economy will regain its momentum due to generally strong U.S. consumer and business confidence, rising consumer income, and improved global growth.
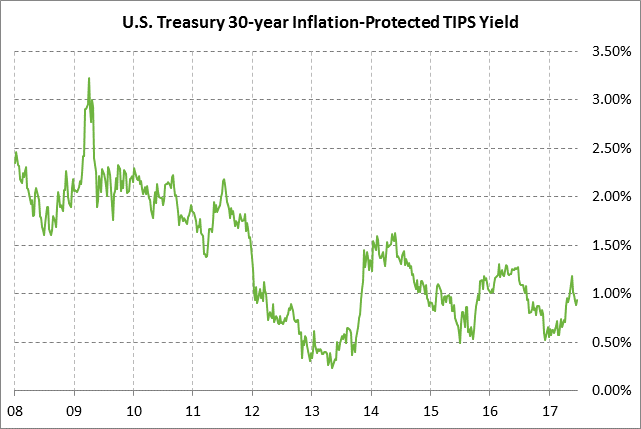
30-year TIPS auction — The Treasury today will sell $5 billion of 30-year TIPS in a reopening of Feb’s 7/8% 30-year TIPS of Feb 2047. The Treasury follows a pattern each year of selling a new 30-year TIPS in February and then reopening that issue in June and October. The benchmark 30-year TIPS was trading at 0.905% late Wednesday afternoon.
The 12-auction averages for the 30-year TIPS are as follows: 2.46 bid cover ratio, $14 million in non-competitive bids to mostly retail investors, 7.5 bp tail to the median yield, 17.4 bp tail to the low yield, and 57% taken at the high yield. The 30-year TIPS is the third most popular coupon security among foreign investors and central banks. Indirect bidders, a proxy for foreign buyers, have taken an average of 69.8% of the last twelve 30-year TIPS auctions, which is well above the average of 59.9% for all recent coupon auctions.