- Markets take in stride Fed’s rate-hike and balance sheet roll-off program
- Unemployment claims indicate layoffs remain at decade-plus lows
- U.S. industrial production expected to eke out a small gain after April’s surge
Markets take in stride Fed’s rate-hike and balance sheet roll-off program — The U.S. stock and bond markets generally took in stride Wednesday’s 25 bp FOMC rate hike and the release of the details of the Fed’s balance sheet roll-off program. Fed Chair Yellen’s comments were a little more hawkish than expected on balance because she waived off the recent weakness in inflation as transitory and suggested there would be no impact on the Fed’s near-term rate-hike intentions. In addition, the Fed-dot median was left unchanged with FOMC members still anticipating roughly three rate hikes per year through 2019.
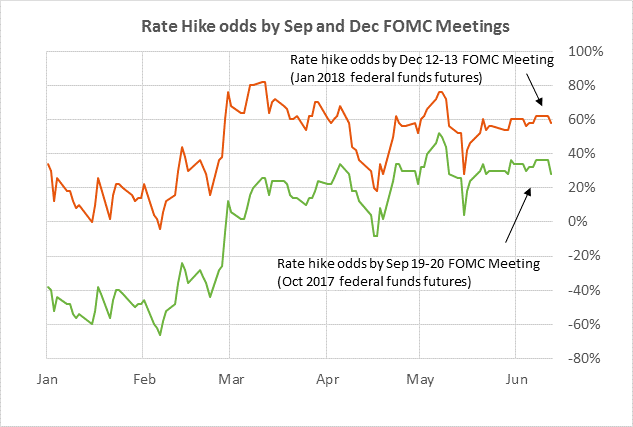
The federal funds futures curve on Wednesday turned more dovish by 2 bp for the late-2017 contracts, 2-4 bp for the 2018 contracts, and 4-6 bp for the 2019 contracts. The odds on Wednesday for a September rate hike fell to 28% from 36% and the odds for a December rate hike fell to 58% from 62%. The outlook for Fed policy turned more dovish because of (1) Wednesday’s weak May retail sales report of -0.3% and May CPI report of +1.9% y/y and +1.7% core (vs April’s +2.2% and +1.9%, respectively), and (2) the Fed’s announcement of the details of its balance sheet roll-off program, which could mean the Fed is putting a higher priority on starting its roll-off program this year than on raising rates another notch.
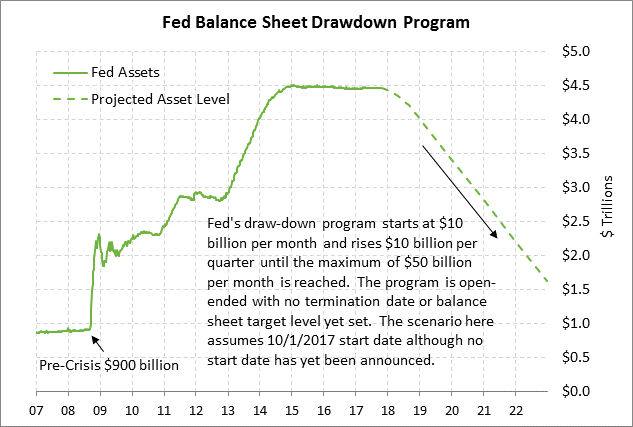
The markets seemed unperturbed by the details of the Fed’s balance sheet roll-off program even though the program seems fairly aggressive to us. The Fed did not say when the program will begin, but we suspect the Fed will start the program on October 1 in order to make the program coincident with calendar quarters. The Fed has so far only said it would start the program “later this year” and Fed Chair Yellen yesterday said the program could begin “relatively soon.”
The roll-off program’s initial cap of $10 billion per month ($6 billion of Treasuries and $4 billion of mortgage securities) was right in line with the median of a recent Bloomberg survey. The cap will then rise by $10 billion per quarter until it reaches the maximum cap of $50 billion per month. If the Fed starts the program on Oct 1, then the Fed’s balance sheet would fall by $30 billion in 2017, $420 billion in 2018, and $600 billion per year in 2019 and beyond.
The Fed did not specify how long the roll-off program will last or what the final target level will be for its balance sheet level. That open-ended nature of the roll-off program was in line with market expectations because Fed Governor Powell had already told the markets that the Fed first needs to decide on its long-term framework for monetary policy (i.e., either a floor or corridor system) before it can determine the optimal level for its balance sheet. Former Fed Chair Ben Bernanke has mentioned a target of $2.5 trillion, which would be reached in mid-2021 (i.e., in about 4 years) under the Fed’s announced roll-off program.
The roll-off program will have a dual effect. First, the program means the Fed will be reducing the level of excess reserves in the banking system, thus reducing banking system liquidity. Second, the program means the Fed will be progressively stepping away as a buyer in the Treasury and mortgage-securities markets, putting some upward pressure on Treasury yields and mortgage rates.
The Fed is trying to pass off the roll-off program as “watching paint dry,” a description that Ms. Yellen repeated on Wednesday. However, the $50 billion per month maximum size of the roll-off program is nearly 60% of the size of the Fed’s QE3 program (2012-2014) of $85 billion per month. If the Fed thought it was having a positive impact with its $85 billion per month QE3 program, then it hard to argue that a program that is only 40% smaller will be as negligible as watching paint dry.
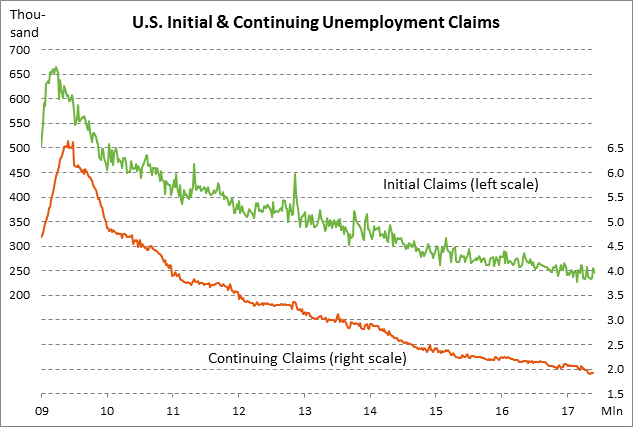
Unemployment claims indicate layoffs remain at decade-plus lows — The initial and continuing unemployment claims series show that layoffs remain at decade-plus lows, indicating a continued strong labor market where businesses are holding on to their employees. The initial claims series is only +18,000 above its 44-year low of 227,000 posted in February and the continuing claims series is only +18,000 above its 28-3/4 year low of 1.899 million posted in May. The consensus is for today’s initial unemployment claims report to show a -4,000 decline to 241,000, adding to last week’s -10,000 decline to 245,000. The consensus is for today’s continuing claims report to show a small +6,000 increase to 1.923 million following last week’s -2,000 decline to 1.917 million.
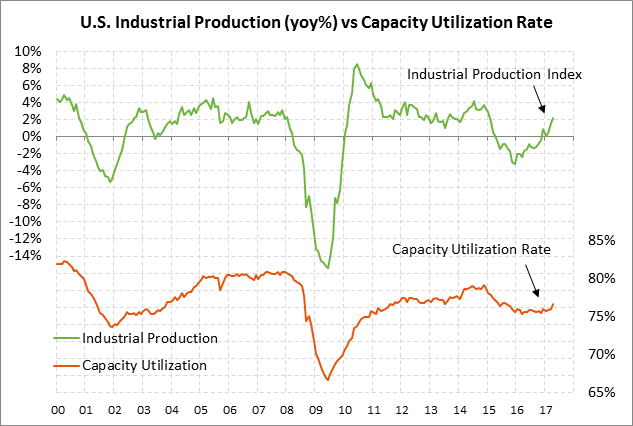
U.S. industrial production expected to eke out a small gain after April’s surge — The market consensus is for today’s May industrial production report to settle back to +0.2% m/m after April’s strong gain of +1.0%. Excluding the mining and utility sectors, today’s May manufacturing production report is expected to edge higher by +0.1%, adding to April’s strong +1.0% gain.
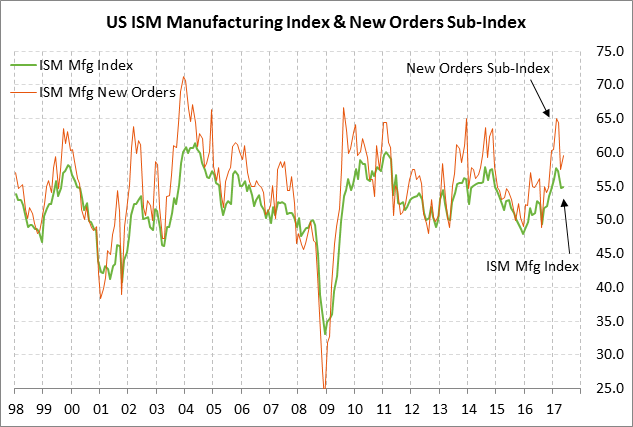
U.S. industrial production has risen for three straight months (Feb-April) as production and shipments catch up with the post-election surge in orders seen during Dec-March. The improvement in industrial production also stems from stronger global economic growth and the weaker dollar seen so far this year. Questions remain for the U.S. manufacturing sector, however, since manufacturing confidence has slipped in the past several months. The ISM manufacturing index in the past three months (Mar-May) has fallen by a net -2.8 points to 54.9 while the ISM manufacturing new orders sub-index has fallen by a net -5.6 points to 59.5. Still, those are relatively strong confidence levels that suggest that the U.S. manufacturing sector should continue to grow at a solid pace in coming months.