- U.S. GDP expected to recover modestly in Q2 after today’s Q1 revision
- Unemployment claims expected to remain favorable
- SPX seasonals are favorable for July but then turn negative in Aug-Sep
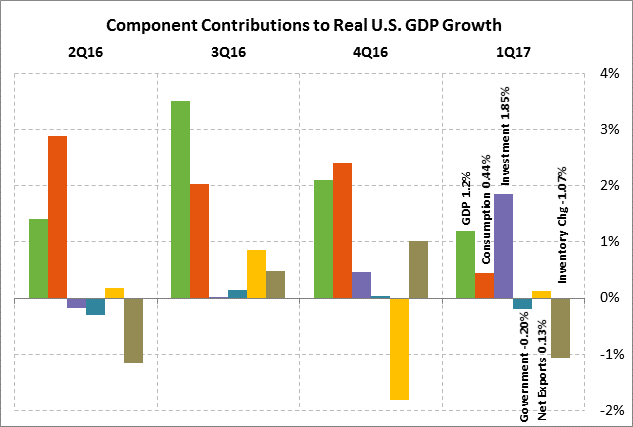
U.S. GDP expected to recover modestly in Q2 after today’s Q1 revision — The market consensus is for today’s third print for Q1 GDP to be unrevised from the last report of +1.2% (q/q annualized). The market is expecting today’s Q1 personal consumption report to also be left unrevised at +2.2%.
Q1 GDP was weak at +1.2% mainly because of weak personal consumption, which contributed only +0.44 percentage points to Q1 GDP, much weaker than last year’s average quarterly contribution of +2.1 points. In addition, inventories subtracted -1.07 points from Q1 GDP, which means that Q1 GDP growth ex-inventories actually looked a lot better at +2.3%. The main source of growth in Q1 was business investment with a +1.85 point contribution.
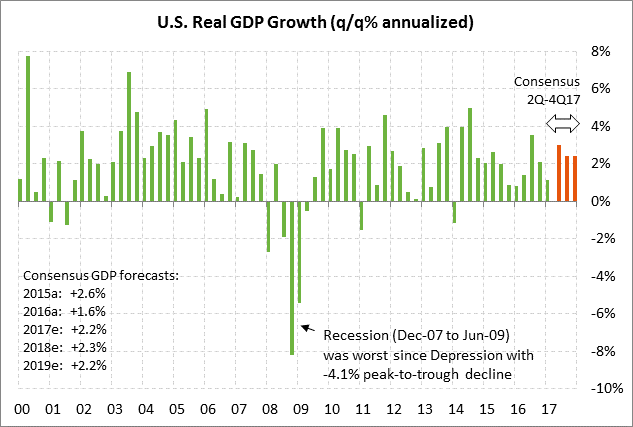
Looking ahead, the market consensus is that U.S. GDP will recover to +3.0% in Q2, but then ease to +2.4% in the second half of the year. The expected Q2 GDP figure of +3.0% looks good in theory but the increase will actually be only about +2.3% after subtracting the expected +0.7 point boost from inventories. That would mean that Q2 GDP ex-inventories may be little changed from the Q1 ex-inventories report of +2.3%.
There is some downside risk to the Q2 GDP forecast since most of the recent U.S. economic data has been weaker than expected. The Bloomberg U.S. Economic Surprise index on Wednesday fell to a new 7-month low of -0.168, illustrating how the recent economic data has substantially under-performed market expectations.
On an annual basis, the market consensus is for U.S. GDP growth of +2.2% in 2017, +2.3% in 2018, and +2.2% in 2019. The Fed is less optimistic than the market and is forecasting lower U.S. GDP growth rates of +2.1% in 2017 and 2018, easing to +1.9% in 2019.
There is not likely to be any boost in U.S. GDP growth from the Trump/Republican agenda for the remainder of 2017. However, we expect Republicans to be able to approve at least a moderate-sized tax cut package by year-end, which should give the U.S. economy at least a modest boost in 2018.
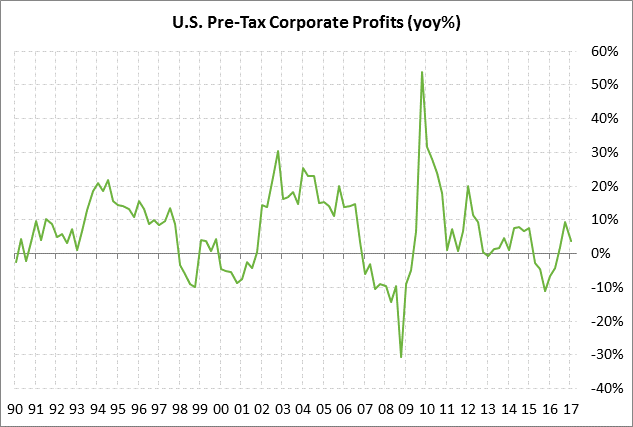
The markets will be watching today’s revision for Q1 corporate profits, which were reported last month at a disappointing -1.9% q/q. On a year-on-year basis, U.S. Q1 corporate profits dipped to +3.7% y/y from Q4’s strong increase of +9.3% y/y.
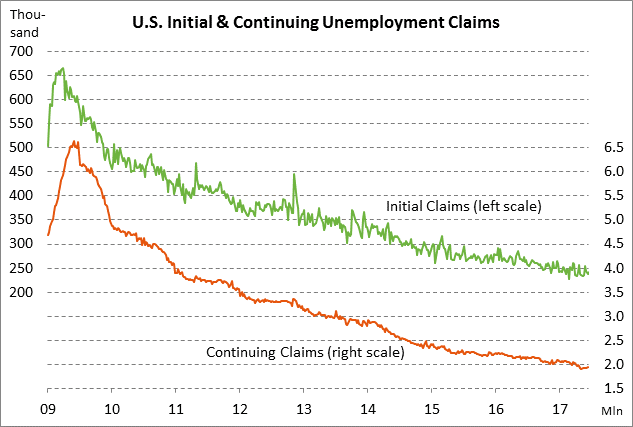
Unemployment claims expected to remain favorable — U.S. layoffs remain at decade-plus lows, providing an indication of the strong labor market where businesses are holding on tightly to their current employees. The initial claims series is only +14,000 above the 44-year low of 227,000 posted in February and the continuing claims series is only +45,000 above the 28-year low of 1.899 million posted in May. The market consensus is for today’s initial claims report to show a small -1,000 decline to 240,000 (versus last week’s +3,000 gain to 241,000) and for continuing claims to show a -10,000 decline to 1.934 million (versus last week’s +8,000 to 1.944 million).
On the hiring front, the news has been less positive with businesses cutting back on their hiring in 2017 so far. Payroll growth showed an average monthly increase of +121,000 in Jan-March, well below the 2016 month average of +187,000. The slower hiring this year reflects (1) weaker GDP growth in Q1, and (2) a reduced need for new employees considering that U.S. businesses have already hired 16.4 million people since the trough of the Great Recession.
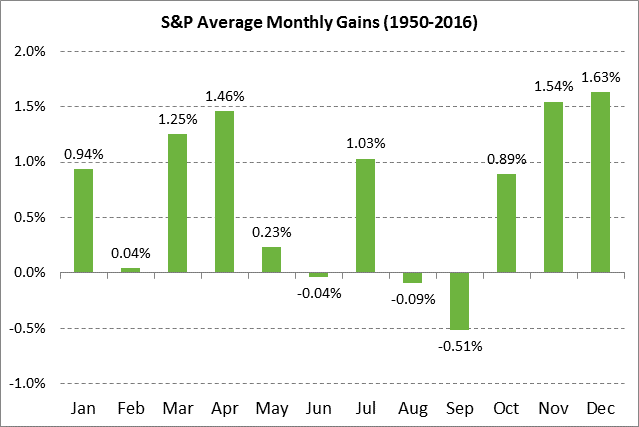
SPX seasonals are favorable for July but then turn negative in Aug-Sep — Seasonal tendencies are favorable for the S&P 500 index in July but then turn unfavorable in August and September. Since 1950, the S&P 500 index has shown an average monthly gain of +1.03% in July, the fifth best month of the year. However, the average monthly change then falls to -0.09% in August and to -0.51% in September, the worst month of the year.
While average monthly change in stock prices is important for considering seasonals, it is also important to note the months of the year when unusually large moves tend to happen. Starting in August, we will be moving into the most dangerous time of the year for unusually large sell-offs.
In the past six decades there have been eight times when the S&P 500 has shown a monthly decline of more than 10%. Six of those eight plunges occurred during the dangerous period of August through November. The worst months, with two 10%-plus plunges, were September (in 1974 and 2002) and October (in 1987 and 2008). The two other bad months during that time frame, with one 10%-plus plunge, were in August (1998) and November (1973).