- U.S. Oct core CPI expected to remain stable
- Rise in U.S. inflation expectations is mainly due to oil prices and is of reduced importance for the Fed
- U.S. retail sales expected to stagnate after Sep’s spending surge
- EIA weekly report
U.S. Oct core CPI expected to remain stable — The market consensus is for today’s Oct CPI report to ease to +2.0% y/y from Sep’s +2.2%. However, the Oct core CPI is expected to be unchanged at +1.7% y/y. The CPI in September rose to +2.2% y/y from Aug’s +1.9% in part because of hurricane disruptions that raised the price of gasoline and other goods and services that were in short supply in storm areas. Even though gasoline prices continued to move higher in October, the overall headline CPI is expected to ease slightly, giving back most of the gain seen in September.
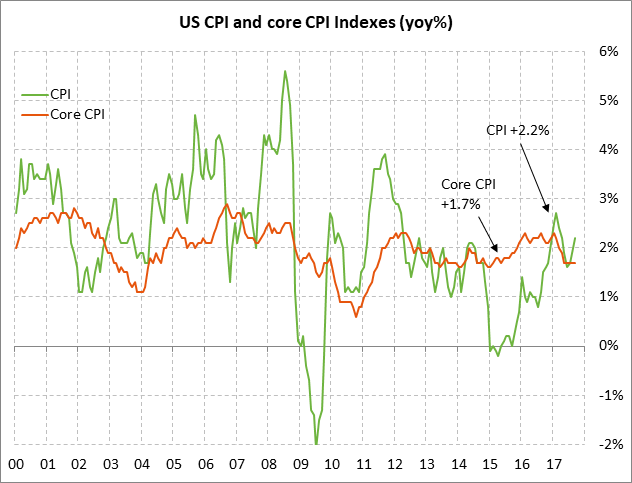
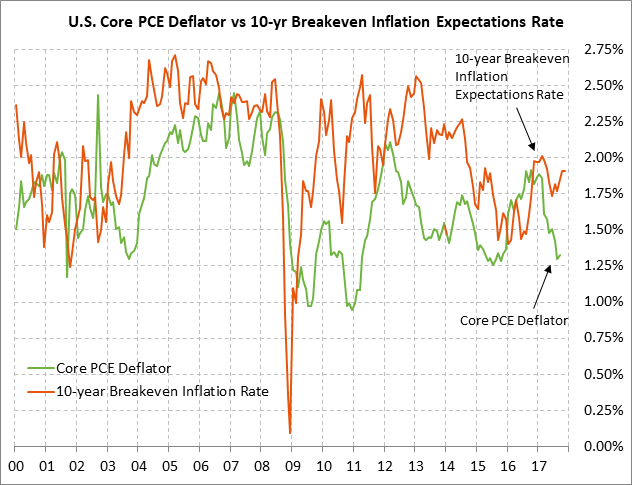
The core CPI has been remarkably stable at +1.7% y/y for five consecutive months, which is a 2-3/4 year low and is comfortably below the Fed’s +2.0% inflation target. Moreover, the PCE deflator, the Fed’s preferred inflation measure, has been weaker than the CPI. In September the PCE deflator was at +1.6% y/y and the core deflator was at only +1.3% y/y.
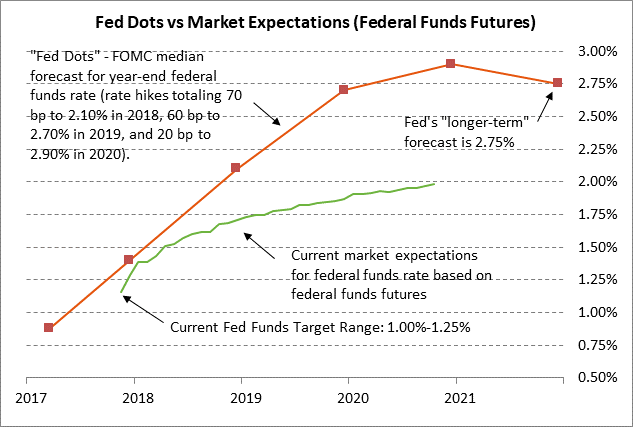
The Fed believes that the softness in the U.S. inflation statistics is transitory and that inflation will eventually rise towards the Fed’s medium-term +2.0% inflation target due to the stronger economy and the tight labor market. However, the inflation statistics will mainly have an impact on the Fed for its 2018 rate-hike decisions. The fact remains that the market is discounting a 100% chance the Fed will raise its funds rate by another +25 bp at its meeting on Dec 12-13. Today’s CPI report will not change that calculus.
The Fed’s rate-hike actions in 2018 in any case remain subject to considerable uncertainty. Most Fed officials insist that the Fed will follow the Fed-dot forecasts of raising interest rates three more times during 2018 by a total of +75 bp, bringing the funds rate to 2.10% by the end of 2018. The markets, by contrast, are expecting the Fed to raise rates by only another +33 bp in 2018 to 1.71% after December’s rate hike. The inflation statistics will be a key determinant of the size of the Fed’s overall rate hike in 2018.
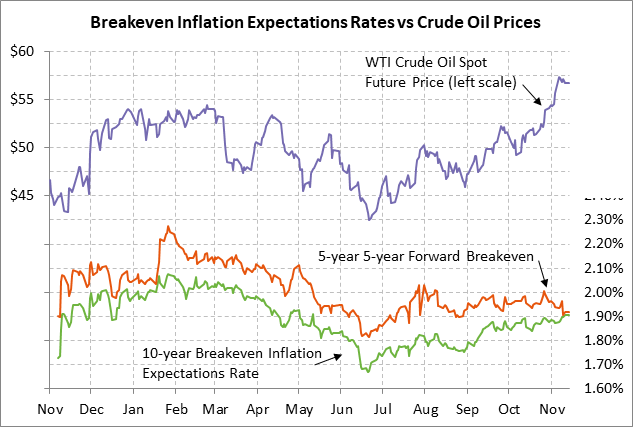
Rise in U.S. inflation expectations is mainly due to oil prices and is of reduced importance for the Fed — The 10-year breakeven inflation expectations rate has risen by +25 bp to a 6-month high of 1.91% from the 1-year low of 1.66% posted in June. The breakeven rate measures the difference between the nominal 10-year T-note yield and the 10-year inflation-adjusted TIPS yield. The 10-year breakeven rate provides an approximation of the market’s inflation expectations over the next 10 years. Inflation expectations have risen in part because of GDP growth near +3.0% in Q2-Q3 and the tight labor market, which is likely to eventually push wages higher. However, the main reason for the rise in the 10-year breakeven rate is simply the sharp 38% rally in WTI crude oil prices seen in the past 5 months to a 3-year high. The nearby chart illustrates the fairly close correlation seen between the 10-year breakeven rate and spot oil prices since 2007.
However, the fact that the breakeven rate tracks oil prices so closely reduces the breakeven rate’s importance for the Fed. The Fed of course closely monitors inflation expectations for an idea of what the market thinks about inflation. However, the Fed is more interested in the actual inflation statistics like the PCE deflator than an oil-link inflation expectations measure. That is why Fed officials continue to express worry about the weak U.S. inflation statistics even though the breakeven rate has been moving higher.
Moreover, it is important to note that the market actually believes that there will only be a near-term upward bump in inflation from oil prices, which will later dissipate. This is seen by the fact that the 5-year 5-year forward breakeven rate has been steady since August and has even fallen in the past two weeks despite the continue rally in oil prices. The 5-year 5-year forward breakeven rate measure inflation expectations on the horizon of 5-10 years and ignores inflation expectations from 1-5 years. The 5-year 5-year forward breakeven rate therefore screens out any upward inflation pressure that is expected for the next 1-5 years but is expected to then disappear during 5-10 years. Screening out oil prices is particularly appropriate under the current circumstances because the WTI oil futures curve is currently inverted, with oil prices expected at $55-57 over the next two years but with oil prices expected to be lower near $52-53 during 2020-2026.
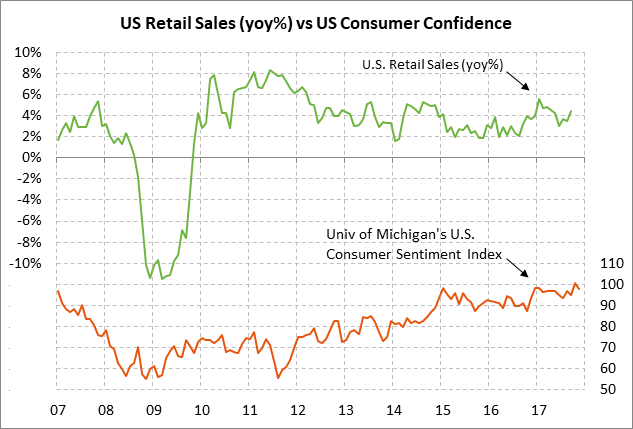
U.S. retail sales expected to stagnate after Sep’s spending surge — The market consensus is for today’s Oct retail sales report to be unchanged and +0.2% ex autos. Retail sales are expected to stagnate in October after surging in September by +1.6% (+1.0% ex autos) because of hurricane-related purchases. In particular, vehicle sales in September surged to a 12-year high of 18.47 million vehicles due to the need to replace vehicles damaged by Hurricane Harvey. The fact that U.S. retail sales ex-autos in October is expected to show a further increase of +0.2%, adding to Sep’s +1.0% increase, illustrates the general strength of consumer spending. Indeed, personal consumption contributed 1.62 percentage points to the Q3 GDP report of +3.0% after adding 2.24 points to the Q2 GDP report of +3.1%.
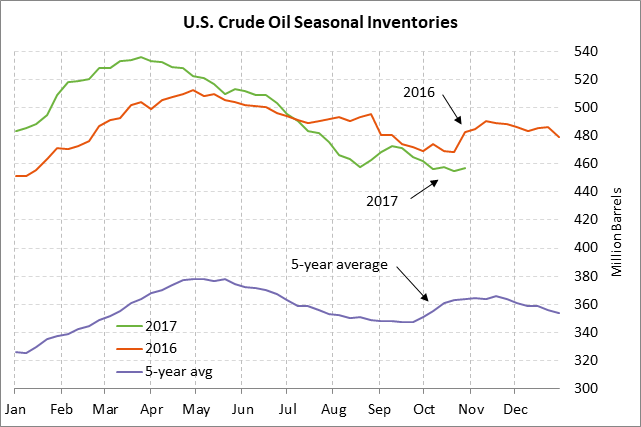
EIA weekly report — The market consensus for today’s weekly EIA report is for a -2.0 mln bbl decline in U.S. crude oil inventories, a -1.0 mln bbl decline in gasoline inventories, a -2.5 mln bbl in distillate inventories, and a +0.6 point increase in the refinery utilization rate. U.S. oil inventories are still in a glut at +15.1% above the 5-year seasonal average, although that is the tightest level relative to the 5-year average in 2-3/4 years. Meanwhile, gasoline inventories are -0.5% below the 5-year seasonal average and distillate inventories are -2.9% below average. U.S. oil production in last week’s report rose by +0.7% to 9.620 million bpd, which was a record high for that series that has data back to 1983.