- Does the flatter U.S. yield curve imply an impending recession?
- U.S. existing home sales expected to remain strong
- Weekly EIA report
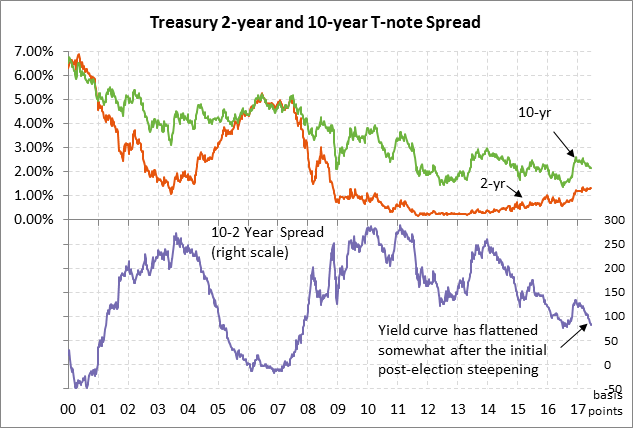
Does the flatter U.S. yield curve imply an impending recession? — The U.S. Treasury yield curve has progressively flattened this year due to (1) the rise in the 2-year yield that has been driven by the Fed’s overall 75 bp rate hike seen since December, and (2) the decline in the 10-year T-note yield that has mainly been caused by reduced inflation expectations.
The 2s10s yield spread is currently at 81.3 bp, which is just mildly above last week’s 10-month low of 79.5 and the 9-1/2 year low of 75.3 posted in July 2016. Still, the 2s10s yield spread is a long way from being inverted, where the 2-year yield would be trading above the 10-year yield. An inverted yield curve is often associated with a recession since it implies a very tight Fed policy.
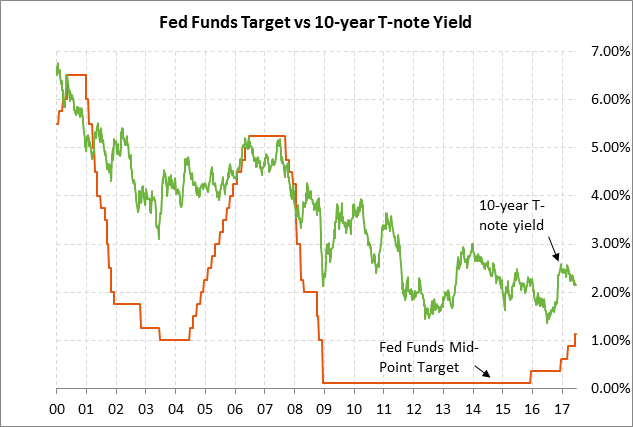
In our view, there are two main reasons why the current flatness in the yield curve has only minor consequences for the U.S. economy and does not imply a recession. First, short term interest rates remain at very low absolute levels and are still very supportive for the economy. Even though the Fed has raised its funds rate target by a total of 100 bp since late 2015, the federal funds rate is still very low at 1.00-1.25% and remains well below inflation.
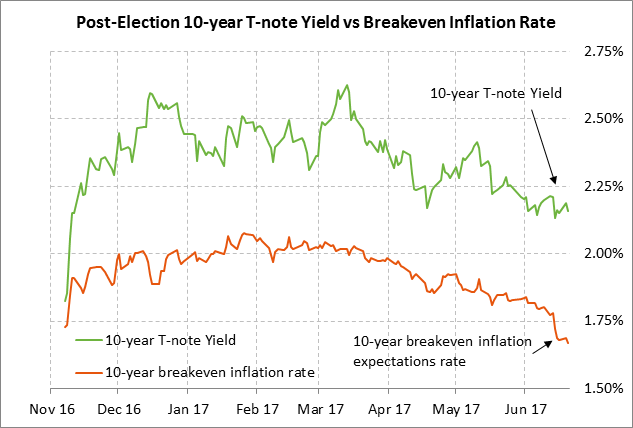
Second, the Fed’s 75 bp rate hike since December has not caused a net rise in the 10-year yield. In fact, the current 10-year T-note yield of 2.16% is -44 bp below the 2.60% level seen just before the Fed started its 3-step 75 bp rate hike on Dec 15, 2016. The low 10-year T-note yield means that mortgage rates and corporate bond yields are also very low, providing ongoing stimulus to the economy.
Since the 10-year breakeven inflation expectations rate fell consistently below 2.00% three months ago on March 14, the 10-year inflation expectations rate has fallen by -31 bp to 1.67% and the 10-year T-note yield has fallen by a similar -26 bp to 2.16%, illustrating how important lower inflation expectations have been in pulling T-note yields lower. The T-note yield has also fallen due to (1) reduced expectations for future Fed rate hikes, and (2) the slow Republican growth agenda.
NY Fed President William Dudley (voter) on Monday said that the low 10-year T-note yield indicates to him that the Fed hasn’t “tightened financial conditions to any significant degree.” Mr. Dudley is basically taking the hawkish view that the Fed should keep raising its federal funds target rate because the overall 100 bp rate hike that has been seen so far has not pushed the 10-year T-note yield higher, which is a sign that short-term rates are not yet high enough to bite.
Many market participants, however, are taking the opposite view that the decline in 10-year T-note yield suggests that the Fed is making a policy mistake because the low T-note yield foreshadows low inflation and a weak economy, suggesting that the Fed should at least pause its rate-hike regime. Some market participants believe that the recent decline in the 10-year T-note yield is essentially a market vote of “no confidence” for the Fed’s intent to keep raising interest rates.
There are good reasons for the 10-year yield to be as low as it is right now, as outlined earlier. However, we suspect that the 10-year yield is currently tracing out the lower end of its range and will move mildly higher as the year wears on. This is based on our expectation for the U.S. economy to regain some momentum in the second half of 2017 and for the Fed’s balance sheet reduction program to put some upward pressure on T-note yields later this year when that program begins.
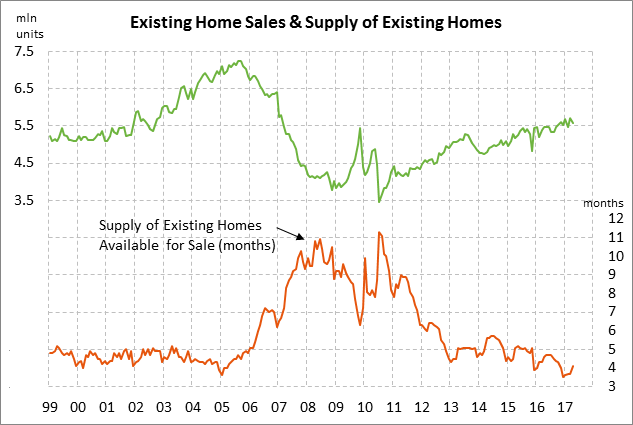
U.S. existing home sales expected to remain strong — The market consensus is for today’s May existing home sales report to show a -0.4% decline to 5.55 million, adding to April’s -2.3% decline to 5.57 million. Despite those declines, U.S. existing home sales remain in very strong shape at only -2.3% below March’s 10-year high of 5.70 million units.
The continued strength of home sales is a positive sign since headwinds for home sales include high home prices as well as the tight supply of homes on the market. There were 4.1 months worth of homes on the market in April, which was a 6-month high but was still below the pre-recession (2000-05) average of 4.5 months.
U.S. home sales continue to see support from (1) consumer confidence about the economy and the labor market, (2) rising household income and wealth, and (3) continued low mortgage rates. The 30-year mortgage rate is currently at 3.89%, which is only +35 bp above the pre-election level despite the fact that the Fed since December has raised interest rates three times by a total of +75 bp. The 30-year mortgage rate is currently near the middle of the 5-year range of about 3.50-4.50%.
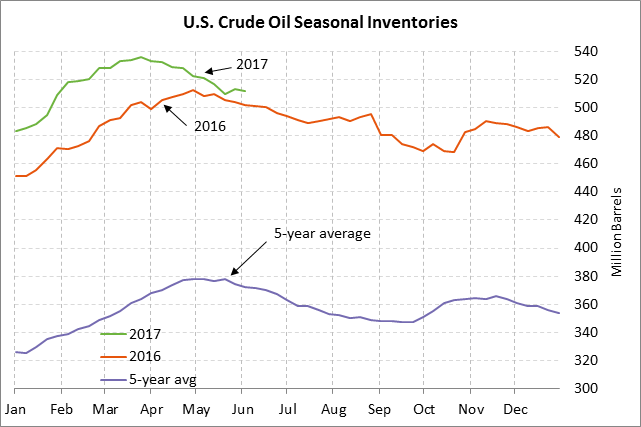
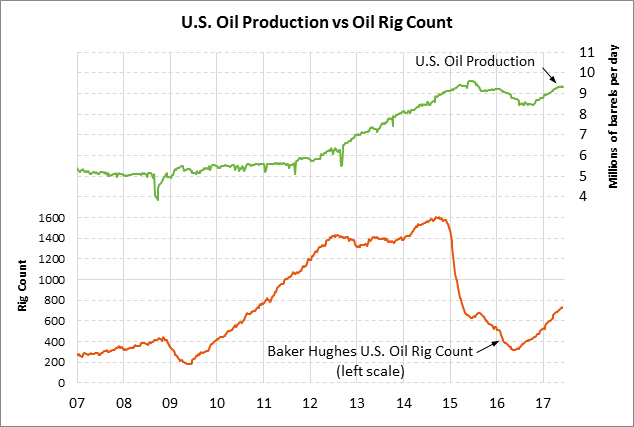
Weekly EIA report — The market consensus for today’s weekly EIA report is for a -1.2 million bbl decline in U.S. crude oil inventories, a +500,000 bbl increase in gasoline inventories, a +500,000 bbl increase in distillate inventories, and an unchanged refinery utilization rate of 94.4%. U.S. crude oil inventories in the past two months have fallen by more than the usual seasonal amount and are now near last year’s levels. However, crude oil inventories are still in a major glut at +26.7% above the 5-year seasonal average. Product inventories remain plentiful as well. Gasoline inventories are +10.8% above their 5-year seasonal average and distillate inventories are +17.2% above average. Meanwhile, U.S. oil production is currently just slightly below the 1-3/4 year high of 9.342 million bpd posted in the week ended May 26.