- Rate-hike expectations ease substantially after FOMC minutes
- U.S. existing home sales expected to remain near the recent 11-year high
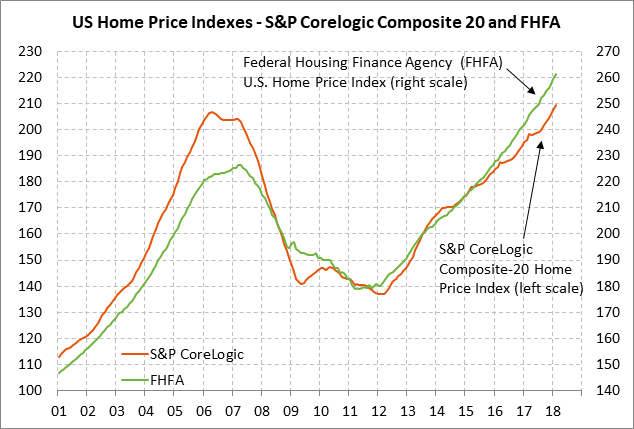
- U.S. FHFA home prices expected to show another strong increase
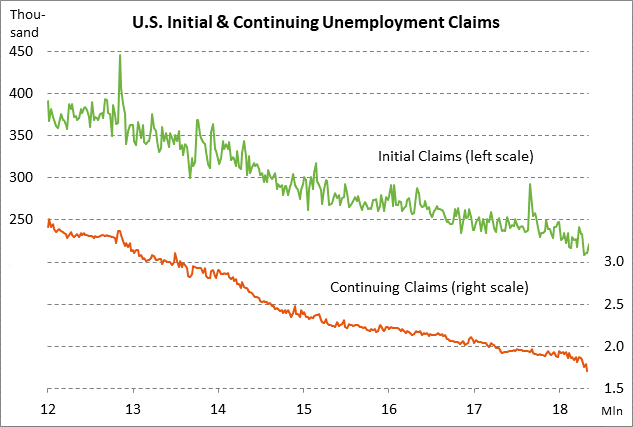
- U.S. unemployment claims remain in very good shape
- T-note package concludes today with 7-year T-note auction
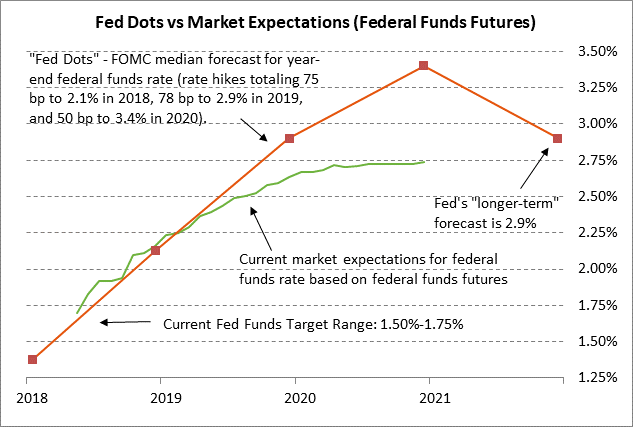
Rate-hike expectations ease substantially after FOMC minutes — The federal funds futures curve yesterday eased substantially after the release of the May 1-2 FOMC meeting minutes. However, the market is still discounting the odds at 100% for a rate hike at the next FOMC meeting on June 12-13 since the minutes said that a rate hike would be appropriate “soon.”
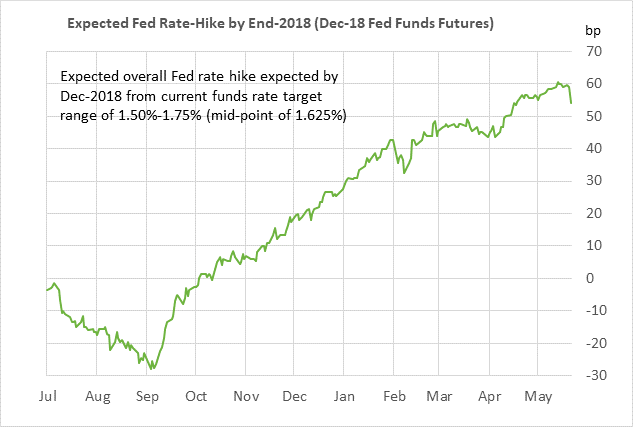
The federal funds futures contracts (on a yield basis) eased by 6-9 bp for the 2019-2020 contracts. The market is now discounting the odds for a fourth rate hike this year in December at only 44%, down from 70% before yesterday’s minutes. The market cut expectations for the overall Fed rate hike by the end-of-2019 by 7 bp to 101 bp from 108 bp on Tuesday.
The less hawkish medium-term Fed view was sparked by the acknowledgement in the minutes that a temporary period of inflation “modestly above 2% would be consistent with the committee’s symmetric inflation objective and could be helpful in anchoring longer-run inflation expectations.” That provided confirmation that the Fed is not going to panic and accelerate its rate-hike schedule if inflation rises above 2%.
In addition, the Fed said it was not even sure that inflation will remain as high as 2% with its statement that, “It was noted that it was premature to conclude that inflation would remain at levels around 2%, especially after several years in which inflation had persistently run below the committee’s 2% objective.” The PCE deflator in March reached a 1-year high of +2.0% y/y, while the core PCE deflator lagged slightly at +1.9% y/y.
The minutes also displayed concern among some members about the flattening yield curve and continuing trade tensions, which argue for a less hawkish Fed policy.
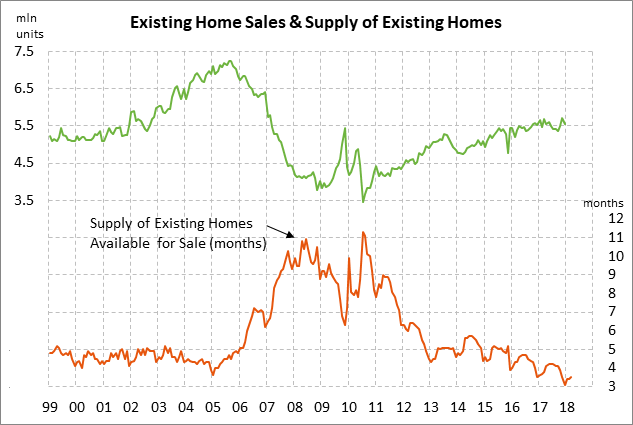
U.S. existing home sales expected to remain near the recent 11-year high — The market consensus is for today’s Apr existing home sales report to show a -0.9% decline to 5.55 million units, reversing most of March’s +1.1% increase to 5.60 million units. U.S. home sales remain in strong shape at only -2.1% below the 11-year high of 5.72 million units posted in Nov 2017.
While demand for homes is strong, home sales are being curbed by relatively tight supplies. There is only a 3.5 month supply of homes on the market, which is much tighter than the long-term average of 7 months and the 2000-05 pre-crisis average of 4.5 months.
Home sales may also start running into resistance from the reduced home affordability that is being produced by the sharp rise in home prices seen since the financial crisis and the recent rise in mortgage rates. The 30-year mortgage rate last week rose to a 7-year high of 4.61% and has now risen by a total of 80 bp since last September.
U.S. FHFA home prices expected to show another strong increase — The market consensus is for today’s Mar FHFA house price index to show another strong increase of +0.6% m/m, matching Feb’s +0.6% increase. Home prices continue to march higher due to strong demand and tight supplies. The FHFA home price index is sharply higher by +7.2% y/y and has now risen by a total of +46% from the housing bust low.
U.S. unemployment claims remain in very good shape — The unemployment claims series both remain in very good shape and indicate that layoffs are at or near multi-decade lows. The continuing claims series last week fell to a new 44-1/2 year low of 1.707 million and initial claims are only +13,000 above April’s 48-1/2 year low of 209,000. The consensus is for today’s initial unemployment claims report to show a -2,000 decline to 220,000, reversing part of last week’s +11,000 increase to 222,000. The consensus is for today’s continuing claims report to show a +41,000 increase to 1.748 million, reversing about half of last week’s -87,000 decline to 1.707 million.
T-note package concludes today with 7-year T-note auction — The Treasury today will conclude this week’s $115 billion T-note package by selling $30 billion of 7-year T-notes. The $30 billion size of today’s 7-year T-note is up by $2 billion from the $28 billion size that prevailed during most of 2016-17. The Treasury has increased the size of its auctions to finance the larger U.S. budget deficit that has resulted from higher government spending and the Jan 1 tax cuts.
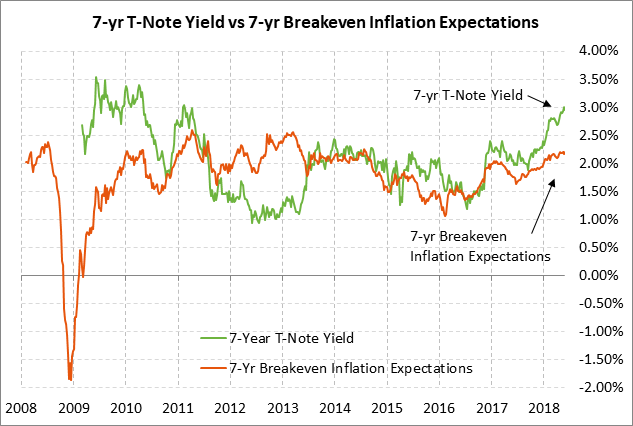
Today’s 7-year T-note issue was trading at 2.95% in when-issued trading late yesterday afternoon, which translates to an inflation-adjusted yield of 0.79% against the current 7-year breakeven inflation expectations rate of 2.16%.
The benchmark 7-year T-note yesterday closed at 2.94%, which was 14 bp below last Thursday’s 7-1/4 year high of 3.08%. The 7-year T-note yield has soared by about 110 bp since last September due to the passage of the massive Jan 1 tax cut combined with increased inflation expectations and expectations for more-aggressive Fed rate hikes over the next several years.
The 12-auction averages for the 7-year are as follows: 2.50 bid cover ratio, $14 million in non-competitive bids, 4.8 bp tail to the median yield, 22.0 bp tail to the low yield, and 52% taken at the high yield. The 7-year is of average popularity among foreign investors and central banks. Indirect bidders, a proxy for foreign buyers, have taken an average of 64.8% of the last twelve 7-year T-note auctions, which is slightly above the median of 64.6% for all recent Treasury coupon auctions.