- 10-year T-note yield nearly touches 3.00% as expectations for Fed’s 2018/19 rate hikes reach a new high
- U.S. consumer confidence expected to remain generally strong despite expected decline
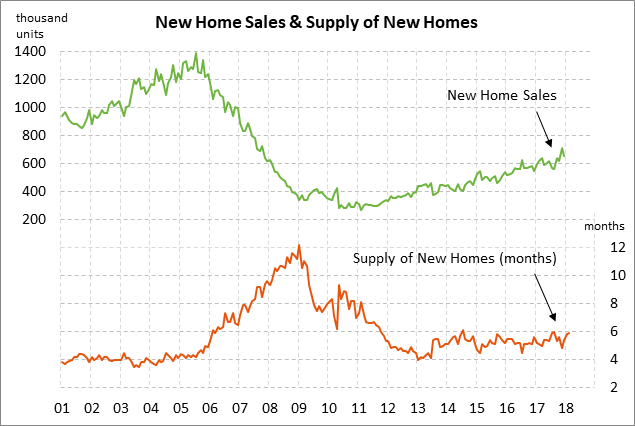
- U.S. new home sales expected to recover modestly
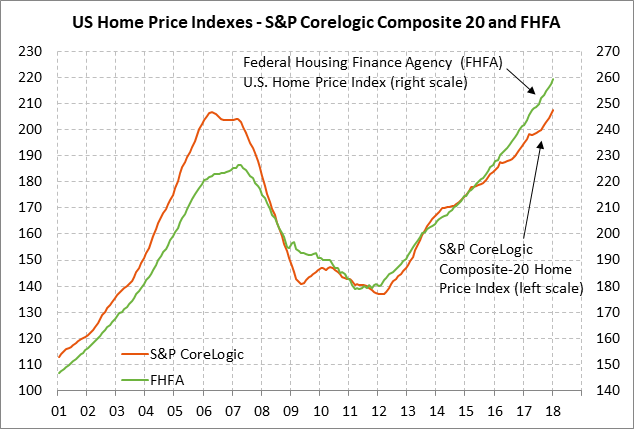
- U.S. home prices expected to continue their sharp advance
- 2-year T-note auction size reaches 4-year high
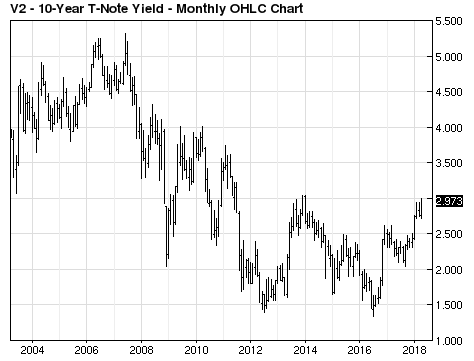
10-year T-note yield nearly touches 3.00% as expectations for Fed’s 2018/19 rate hikes reach a new high — The 10-year T-note yield on Monday rose to a new 4-1/4 year high of 2.996% but then backed off to close the day up +1.5 bp at 2.975%. The 10-year T-note yield on Monday found resistance at the 3.00% level but another stab at that level seems likely. A rise in the 10-year yield above 3.00% would be a bearish psychological event. However, a rise in the 10-year yield above the 6-3/4 year high of 3.05% posted in Jan 2014 would be even more bearish since the yield would then be at levels not seen since 2011.
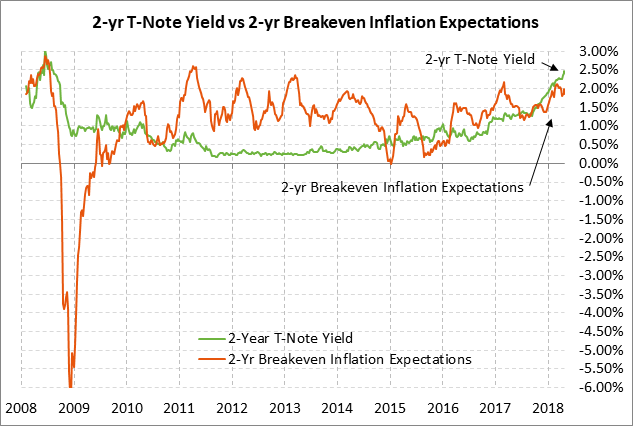
The 10-year yield on Monday was pushed higher by a continued rise in inflation expectations and stronger expectations for Fed rate hikes through 2019. The 10-year breakeven inflation expectations rate on Monday rose to a new 3-3/4 year high of 2.197% as June crude oil prices closed +0.35% at $68.64, just mildly below last Thursday’s new 3-1/4 year nearest-futures high of $69.56.
Meanwhile, market expectations for further Fed rate hikes through 2019 rose to a new record high of 99 bp (4.0 rate hikes). The market is now discounting a 2.62% funds rate by the end of 2019. That is still 28 bp (1.1 rate hikes) shy of the Fed-dot median forecast of 2.90%, which means there is room for a further rise in rate-hike expectations just to catch up with the Fed.
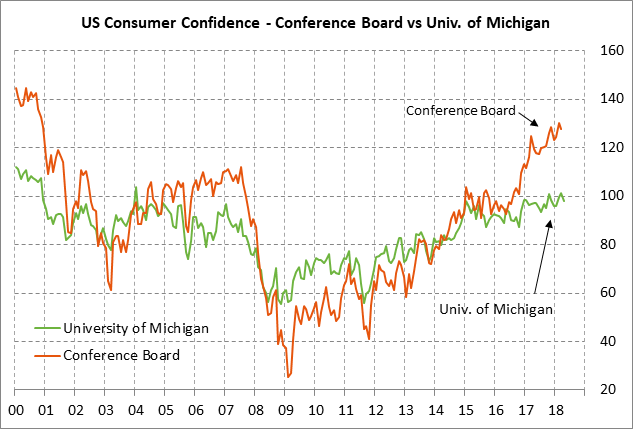
U.S. consumer confidence expected to remain generally strong despite expected decline — The market consensus is for today’s Conference Board Apr U.S. consumer confidence index to fall by -1.7 points to 126.0, adding to March’s -2.3 point decline to 127.7. However, even the expected back-to-back March-April decline would leave the index in strong shape at only -4.0 points below February’s 17-year high of 130.0.
U.S. consumer confidence remains strong due to (1) the strong labor market and rising consumer income, (2) rising household wealth with the continued rise in home prices, and (3) the Jan 1 cut cuts. Negative factors for consumer confidence include (1) the stock market correction, (2) rising gasoline prices, (3) Washington political uncertainty and trade tensions.
U.S. new home sales expected to recover modestly — The market consensus is for today’s March new home sales report to show a +1.9% increase to 630,000, more than reversing Feb’s -0.6% decline to 618,000. New home sales in February were -13.1% below the 10-year high of 711,000 posted in Nov 2017. Demand for new homes remains strong, but sales over the winter were crimped by bad weather, rising mortgage rates, and mildly tight supplies. In addition, new homes remain expensive. The median price of a new home in Feb was $326,800, which is only -5% below the record high of $343,400 posted in Nov 2017.
U.S. home prices expected to continue their sharp advance — The consensus is for U.S. home prices in February to show another solid advance. The consensus is for today’s Feb FHFA house price index to show a strong +0.6% m/m increase, adding to Jan’s +0.8% surge. The consensus is for today’s Composite-20 home price index to show a gain of +0.68% m/m, adding to Jan’s +0.75% increase.
U.S. home prices have been particularly strong since last autumn with the FHFA U.S. home price index in January up by +7.3% y/y and the Composite-20 index up by +6.3% y/y. From the housing bust lows, the FHFA index is up +45% and the Composite-20 index is up +51%.
U.S. home prices continue to move higher due to strong demand and tight supplies. However, there could be some buyer resistance later this year to the high prices as mortgage rates continue to rise, thus increasing the cost of a mortgage. The 30-year mortgage rate last week reached a 4-1/4 year high of 4.47% and has risen by 60 bp since late last year.
2-year T-note auction size reaches 4-year high — The Treasury today will sell $32 billion in 2-year T-notes. The Treasury will then continue this week’s $113 billion T-note package by selling $35 billion of 5-year T-notes and $17 billion of 2-year floating rate notes on Wednesday and $29 billion of 7-year T-notes on Thursday.
The shorter end of the yield curve has taken the brunt of the Treasury’s hike in the size of its auctions to finance the larger federal budget deficit. The larger deficit has resulted from rising government spending and the Jan 1 tax cuts. The Treasury just in the last three months has sharply raised the size of its 2-year auction to today’s 4-year high of $32 billion from the $26 billion size that prevailed during 2016/17.
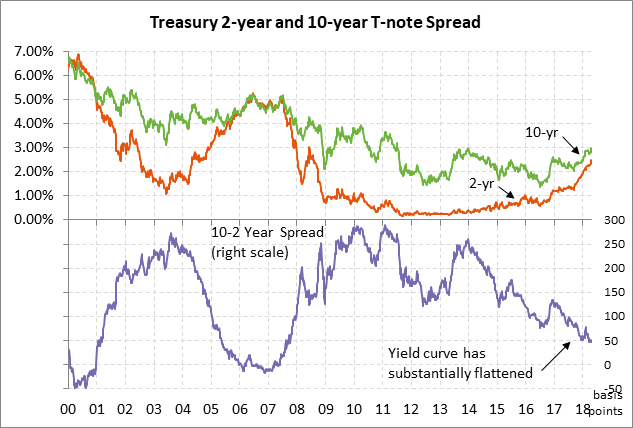
The larger size of the shorter-end coupons has helped cause a flatter yield curve as the supply bulge pushes shorter-term Treasury yield higher. The 10-2 yield spread on Monday of 50 bp was only 7 bp above last week’s 10-1/2 year low of 43 bp. The 2-year T-note yield on Monday rose to a new 9-3/4 year high of 2.49% and has now soared by about 120 bp since late last year.
The 12-auction averages for the 2-year are as follows: 2.87 bid cover ratio, $192 million in non-competitive bids, 4.1 bp tail to the median yield, 22.7 bp tail to the low yield, and 55% taken at the high yield. The 2-year is the least popular security among foreign investors and central banks. Indirect bidders, a proxy for foreign buyers, have taken an average of only 50.0% of the last twelve 2-year T-note auctions, which is well below the median of 64.3% for all recent Treasury coupon auctions.