- FOMC will still be tightening monetary policy with its balance sheet drawdown program even if it pauses its rate-hike regime
- U.S. existing home sales expected to remain weak
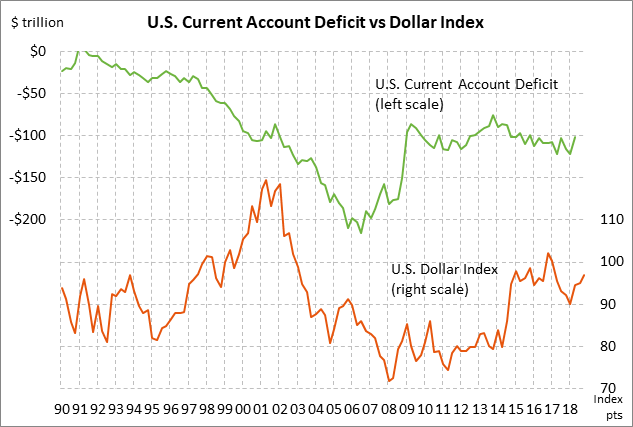
- U.S. current account deficit expected to widen to 9-year high
FOMC will still be tightening monetary policy with its balance sheet drawdown program even if it pauses its rate-hike regime — The market is discounting the odds at about 80% for a rate hike at the 2-day FOMC meeting that ends today. The consensus is for a +25 bp hike in the funds rate target to 2.25%/2.50% and a +20 bp hike in the IOER rate (interest on excess reserves) to 2.40%. The IOER rate has recently been acting as a ceiling on the funds rate. With the expected hike in the IOER rate of only +20 bp to 2.40% (versus the +25 bp hike in the funds rate), the FOMC would be forcing the funds rate to trade closer to the new funds rate target midpoint of 2.375%.
Since a rate hike today is mostly a foregone conclusion, the biggest question will be whether the FOMC softens its language by enough to indicate that the FOMC will pause its rate-hike regime in early 2019. The Fed seems ready to soften its current guidance for “further gradual increases” in rates and switch to a fully data-dependent policy, which would allow for a pause in early 2019 if the U.S. and global macroeconomic outlook deteriorates. Softening language could come in both the post-meeting statement and in Fed Chair Powell’s comments at his post-meeting press conference.
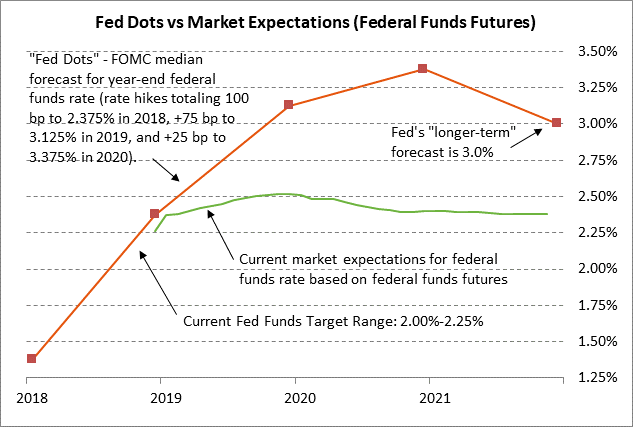
The market this month has sharply curbed its expectations for 2019 rate hikes. Assuming that the FOMC today implements a +25 bp rate hike, the federal funds futures market is then discounting only a 56% chance of one +25 bp rate hike in 2019, which is much more dovish than expectations just a month ago for two rate hikes in 2019.
Market reaction to today’s FOMC meeting will also depend heavily on whether FOMC members substantially reduce their Fed-dot forecasts for funds rate. The Fed dots are currently almost 100 bp more hawkish than the market. The median Fed-dot forecast is for a rate hike this week, three rate hikes in 2019, and one rate hike in 2020, bringing the funds target range to 3.25%/3.50% by late 2020. The market, by contrast, is expecting the funds rate to rise to only 2.50% in 2019 and then move sideways.
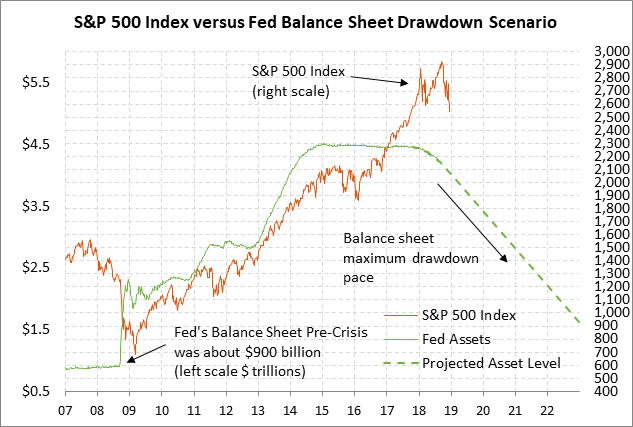
While the Fed’s interest rate policy gets the headlines, the markets are chomping at the bit to hear more about the Fed’s plans for its balance sheet reduction program. The Fed is currently on autopilot, allowing securities to mature in its portfolio at a maximum rate of $50 billion per month. The FOMC has not announced how long the draw-down program will last or the eventual target where the FOMC expects the balance sheet to stabilize.
The Fed’s balance sheet has so far fallen by about $430 billion (-9.5%) from its peak of $4.52 trillion to its current level of $4.09 trillion, but that is still far above both the pre-QE3 level of $2.8 trillion and the pre-crisis level of $900 billion. The market is generally expecting the Fed to draw down the balance sheet to the $2.5-3.0 trillion level and then stop there since the economy is now larger and needs more cash than before the financial crisis. However, the ultimate level of the balance sheet depends in large part whether the Fed ends up deciding on a monetary policy system targeting a corridor or a floor system for managing reserves.
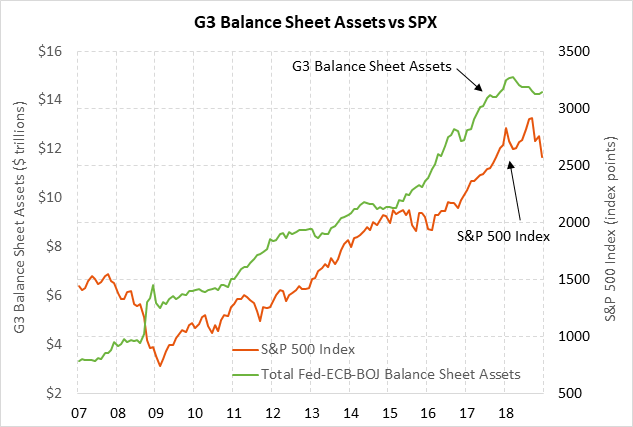
In any case, the Fed’s balance sheet drawdown program has caused a decline in the combined balance sheets of the Fed, ECB and BOJ, which is a bearish factor for stocks and commodities. As seen in the nearby chart, the combined Fed-ECB-BOJ balance sheet level topped out at $14.95 trillion in March 2018 and has since fallen by $610 billion (-4.1%) to 14.34 billion. The combined Fed-ECB-BOJ balance sheet will start falling faster in 2019 since the ECB ends its QE program in two weeks and since the BOJ is engaged in a stealth tapering of its QE program.
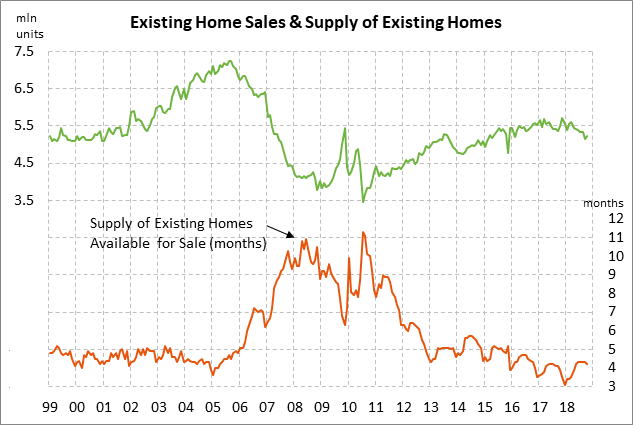
U.S. existing home sales expected to remain weak — The market consensus is for today’s Nov existing home sales report to show a -0.4% decline to 5.20 million, giving back part of October’s +1.4% increase to 5.22 million. U.S. existing home sales in general remain weak at 9% below last November’s 11-1/2 year high of 5.72 million units. U.S. existing home sales dropped for six consecutive months through April-September and finally showed a small increase in October.
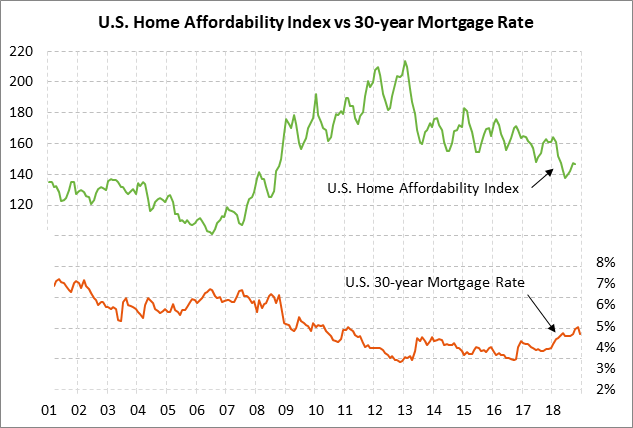
U.S. home sales have been undercut by the sharp deterioration in home affordability caused by the sharp rise in home prices and higher mortgage rates. The National Association of Realtors’ Housing Affordability index fell to a 10-year low of 137.7 in June, although it then rebounded mildly to Oct’s level of 146.9. The index means that a family earning the median family income has 146.9% of the income necessary to qualify for a conventional loan with a 20% downpayment on a median-priced existing single-family home, down from 164.3% as recently as January.
Of the variables in the Affordability index, median income is on the rise but that has been outweighed by the negative factors of rising mortgage rates and the sharp rise in home prices. Home prices have soared by 49% since the housing bust. The current 30-year mortgage rate of 4.63% is down from November’s 7-year high of 4.94% but is still up by about 70 bp from the year-ago level of 3.94%
U.S. current account deficit expected to widen to 9-year high — The consensus is for today’s Q3 current account deficit to widen to -$125.0 billion from Q2’s -$101.5 billion, which would be the widest deficit in more than nine years. U.S. trade flows are currently being distorted as U.S. and overseas companies seek to beat or work around various U.S. tariffs and retaliatory tariffs. Nevertheless, the wider U.S. current account deficit is still an underlying long-term bearish factor for the dollar since a large amount of trade dollars are flowing out of the U.S.